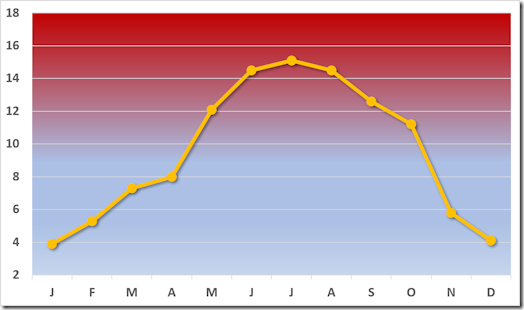
 It seems to have escaped everyone’s attention yet again, but if we draw a horizontal line on a graph of temperature versus time of the year at, say, 10ºC, there is a tendency for the actual temperature to be below 10ºC in winter and above 10ºC in summer. It’s funny, I know. But as far back as I can remember, that’s the way it’s always been.
In 2017, for example, the mean UK temperature for each month is shown in the graph above. Notice how spring and summer was warmer than autumn and winter.
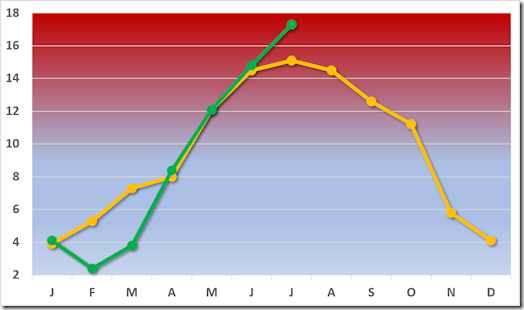
Let’s add 2018’s data so far to this graph.
 The only anomaly – if you can call it that, since February and March were a lot colder than last year – is July. Nevertheless, this is sufficient for the amateurs who go under the title of “reporters” for rags like the Daily Mail and The Sun to get their rulers out, draw a line through May, June, and July, and start predicting that we’re all going to die because by October it’ll be above 60ºC. Of course, come September, they’ll be predicting the usual Ice Age accompanying “the coldest winter on record” (and that’s an actual quote from at least one of those two comics over each of the last three or four years).
Yes, it’s been hot. But it’s not like we haven’t had hot spells before. Just like when it’s cold, it isn’t like we haven’t had cold spells before, either. And it goes up and down throughout the year as we pass through the seasons. Furthermore, even though it has been hot, this year’s “hot” has been quite pleasant most of the time (and I hate hot weather) since it hasn’t been accompanied by the usual humidity we tend to get in the UK.
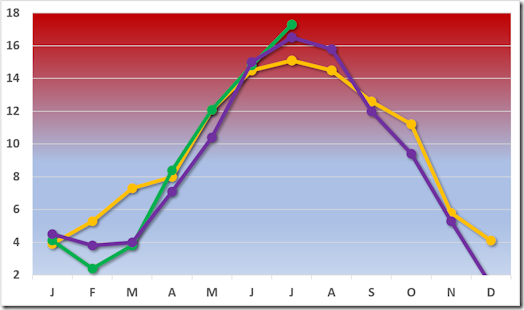
Here’s the same chart with 1976 added to it.
 Fair enough, this July was about 1 degree hotter, but other than that there’s nothing much different. Christ, I was in a maths lesson at school in June in ‘76 and it snowed on the 14th (or was it the 12th… whatever), and it’s not done that since!
When you look through the data from 1910 until the present, July had the same mean temperature recorded for 1983. It was slightly hotter in 2006, and almost as hot in 2013. Other years have simply fallen within the range.
There’s no question that average temperatures have risen over the last hundred years or so – especially since the 1950s – but that doesn’t mean that any new high or low is a sign of Armageddon. Most of it comes down to the Jet Stream. The last few years, it’s spent summer down by the equator, flinging low pressure system after low pressure system at the UK. This year, it’s vacationing somewhere up near Iceland, and fairly consistent high pressure is pulling air up from Europe. It happens.
Sometimes, I’m embarrassed to be British. We moan when it’s hot, we moan when it’s cold. We moan when it’s wet, and we moan when it’s dry. We moan if it’s a crap summer, and we moan if it’s not. For f*$k’s sake, get a life, people. It’s been one of those “glorious” summers just over 50% of the twats out there voted to go back to in 2016. Enjoy it – you might not be able to afford the next one.
Just remember. In a couple of months it’ll be bloody cold again. And probably wet – just like it was before it got hot this year.